Exploring Cloud Cost Forecasting
Establishing an effective cloud forecasting practice is essential for transforming variable cloud expenditures into predictable business drivers that support long-term investment and innovation. Organizations must first define the specific “why” behind their forecasting—such as budget alignment or commitment management—to determine the appropriate level of effort and granularity required. FinOps Practitioners should move beyond manual spreadsheets toward automated, frequency-optimized models that shift ownership to engineering leaders, ensuring that forecasts are based on real-world future plans rather than just historical trends.
Table of Contents
- What is forecasting for FinOps?
- Forecasting and optimization
- Before you start
- Different types of forecasting
- Personas involved with forecasting
- FinOps Forecasting Working Group Survey
- Practitioner lessons learned
- Forecasting KPIs
- Forecasting tools
- Forecasting maturity matrix
- Conclusion
- Acknowledgements
FinOps Forecasting is the practice of predicting future cloud spend, usually based on a combination of historical spending and an evaluation of future plans. A good forecast takes into consideration how potential cloud infrastructure and application changes will impact cloud spend. This allows organizations to understand how the decisions they make will impact the business. A strong forecast should influence budget planning and future cloud investment decisions.
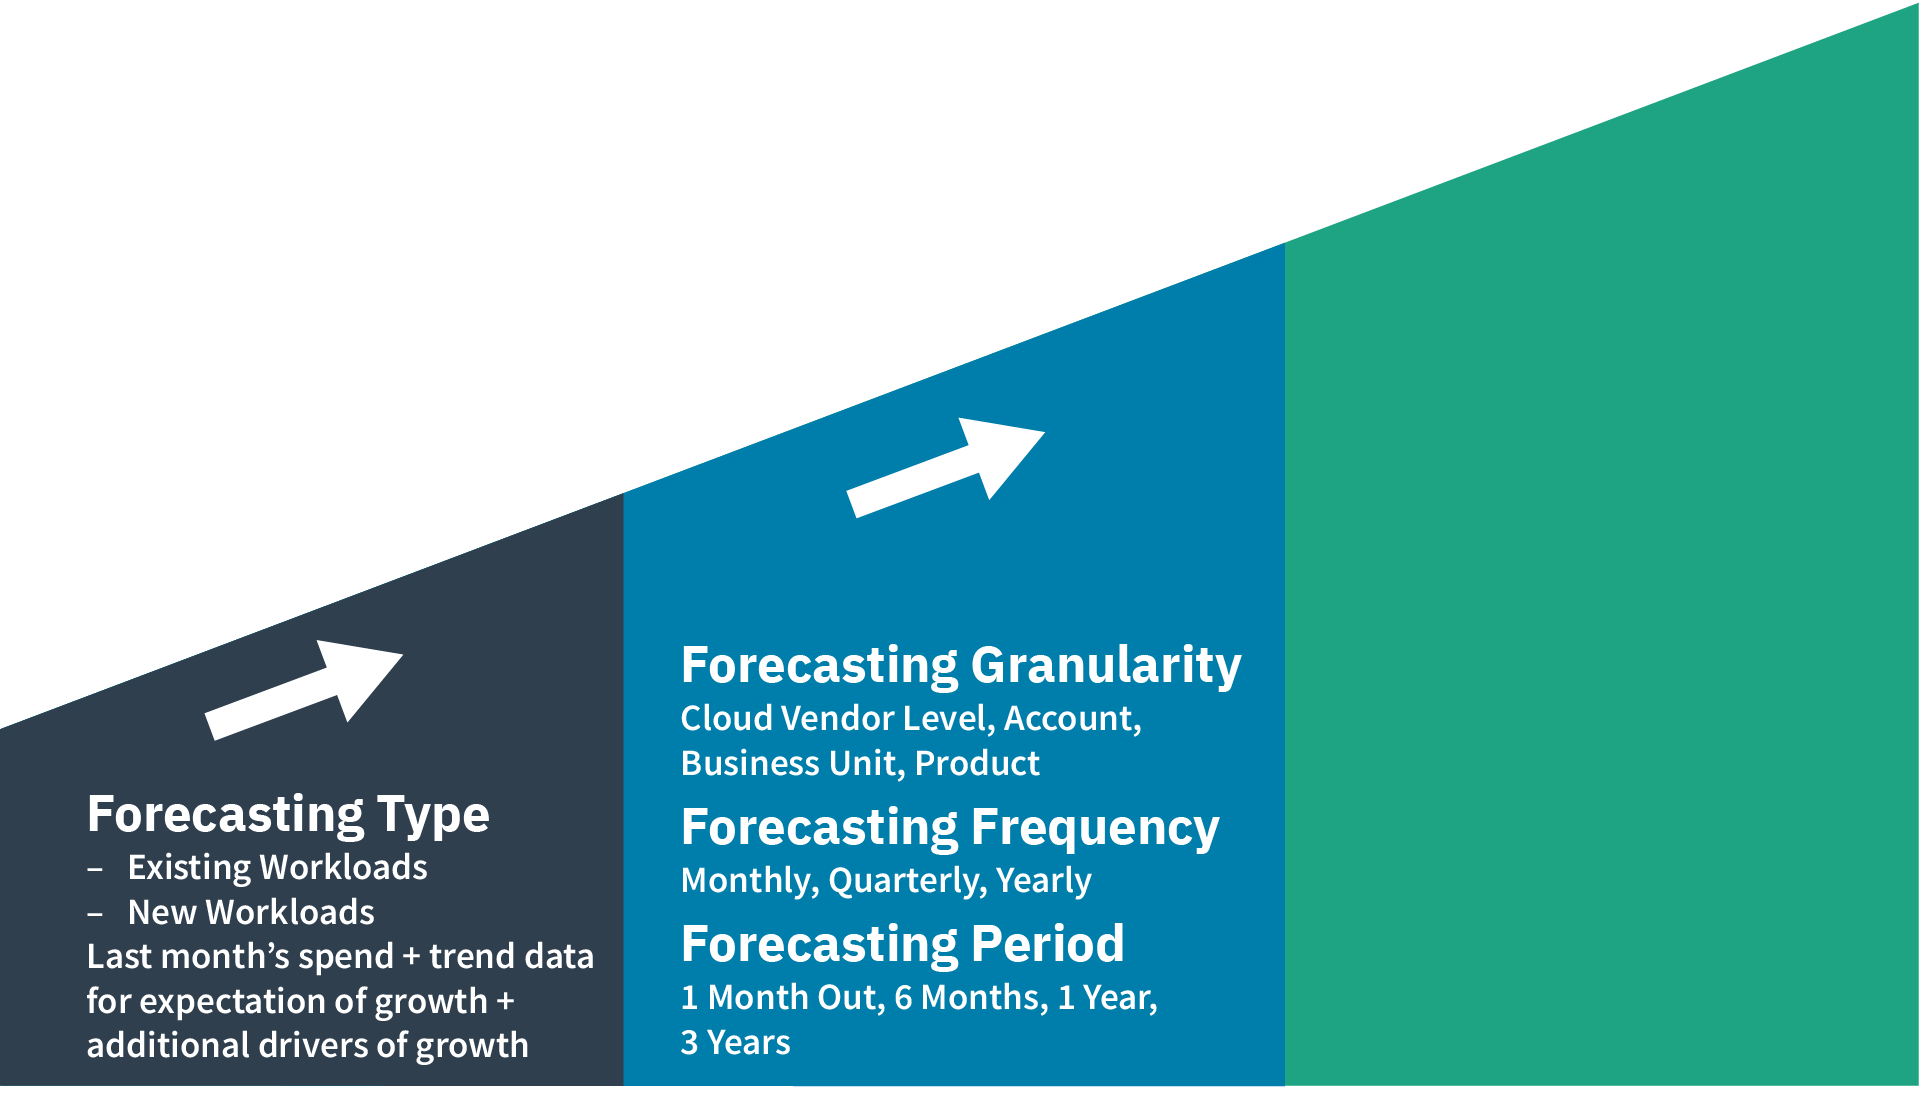
The foundation of a forecast is its underlying assumptions, which require collaboration between stakeholder teams like Finance, Engineering, and Executives. Additional factors include the reason behind the forecast, the vision moving forward (which drives the strategy of the forecast), forecasting granularity & frequency, KPIs, level of effort, and tooling as a start. All of these factors drive improvements in capital efficiency, cost savings, enabling new customer experiences, or growing the top line. The teams should work together to build agreed upon forecast models and KPIs from which to establish budgets that align with business goals.
The following picture gives a view on some of the reasons as to why forecasting might be important to you and your organization:
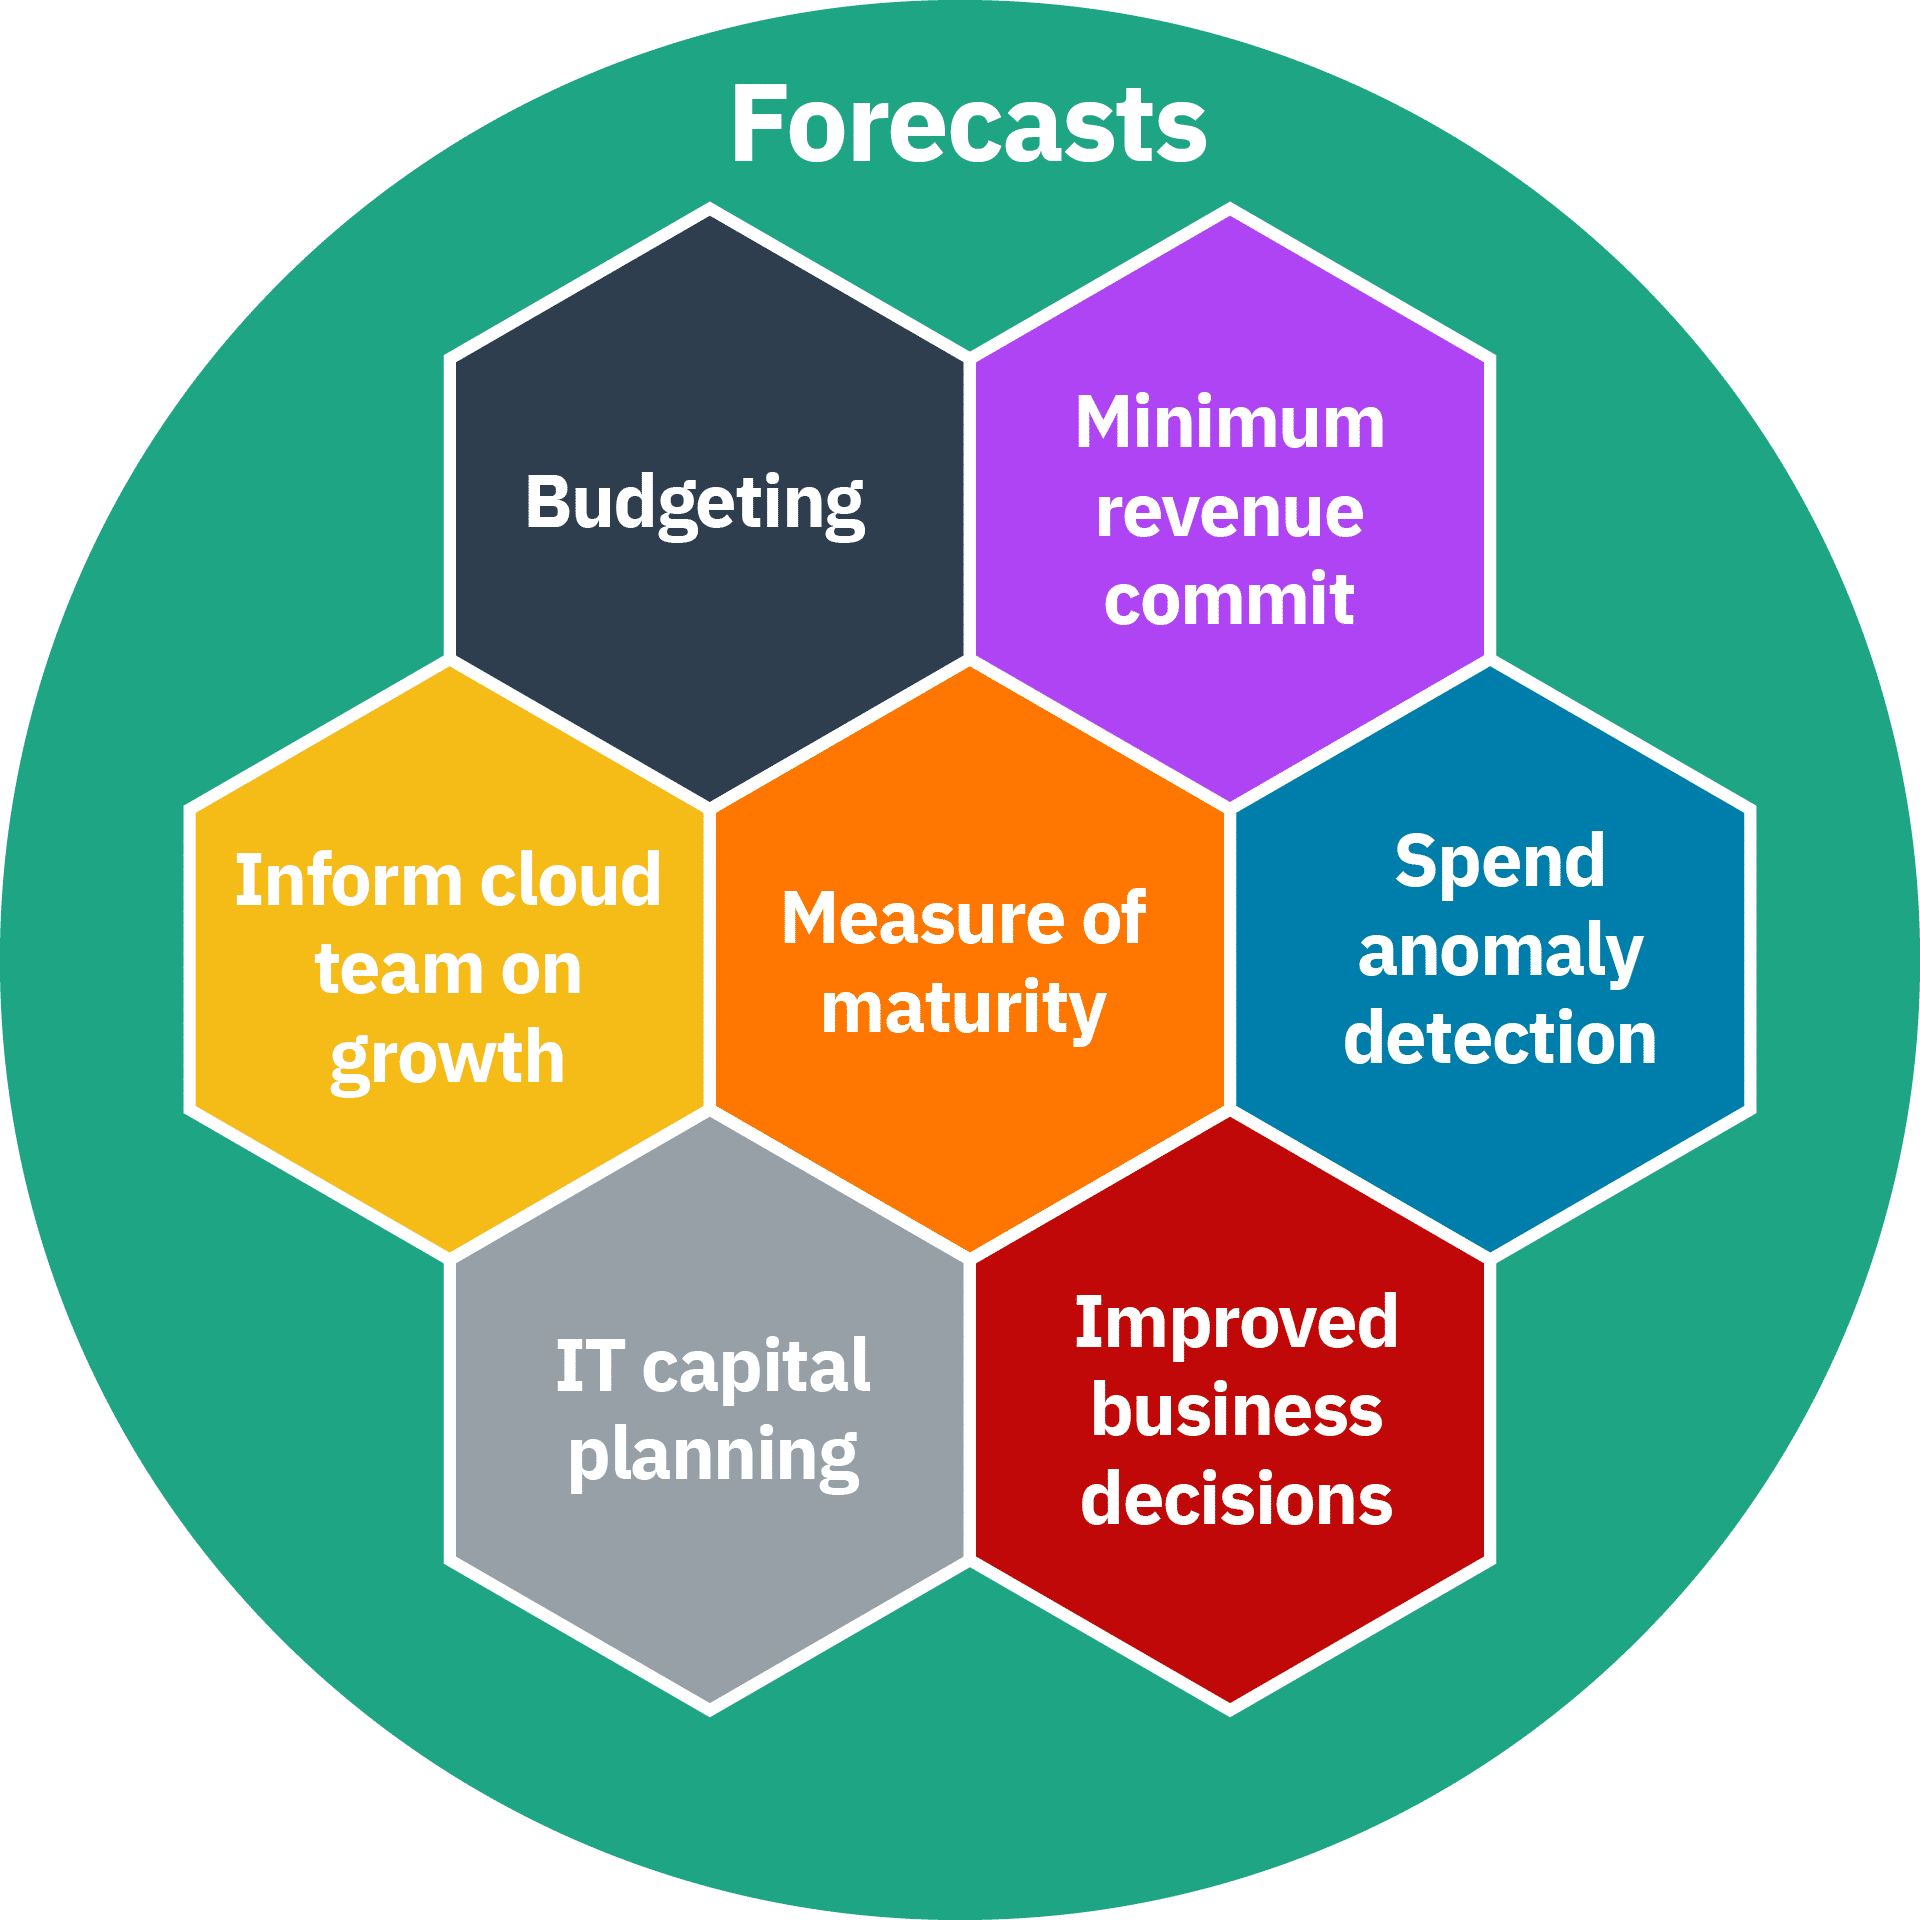
This is not an exhaustive list, but before you spend any time or effort on creating a forecasting process or improving an existing one, you need to be able to answer the question: why do you need cloud forecasts?
The answer to this may be unique to your organization; a government or not for profit may have very different reasons to a large multinational or a born in the cloud start up, they may of course be very similar.
Once you know your “why” this will help you decide how much effort you are willing to spend on the activity.
You’ll read a number of these exerpts from survey participants and interviewees in these callout boxes throughout the paper:
At a recent meetup event a large financial institution described their driver was primarily for the management of their minimum spend commitments and since that was key to them it was worth a considerable amount of effort to set up and create a repeatable process. They also acknowledged that as much as this was the key reason a lot of the above reasons also applied making the effort even more worthwhile.
It is often said that forecasting is an art. An art any company or business which wants to be successful has to undergo in some form or fashion. Whether it is predicting upcoming sales, upcoming spend, upcoming usage or workloads, companies rely on forecasting to obtain a rough picture of their business in the future. There are a couple of beautiful quotes we love when it comes to forecasting:
It is difficult to predict, especially the future.
– Niels Bohr
While Neil Bohr’s quote keeps our aspirations of accuracy in check, the other quote from Paul Saffo is much more instructive.
The goal of forecasting is not to predict the future but to tell you what you need to know to take meaningful action in the present.
– Paul Saffo
Our survey results told us that as organizations mature there are broader benefits of having a forecasting process which include more of the above examples.In the early stages the reasons for forecasting were simpler: budgetary and overall cloud spend position.
Several organizations shared a view as to why forecasting is important: only a small portion of revenue goes into innovation, the type of projects that will create differentiating factors that give the business a competitive advantage. And cloud spend is usually part of the same budget. Forecasting over or under actual spend takes away from potential innovation opportunities. This makes cloud forecasting an important activity to help with innovation and resident growth.
Once there is a why, start delving into the how. There are several trends and themes that have arisen in cloud forecasting which can help direct how to approach cloud forecasting outlined below.
Forecasting and optimization
Successful practitioners have combined forecasting for capital allocation with optimization for execution. Together, these two efforts can provide manageable forecast targets with fine tuning of spending as a way to help manage TCO.
Common forecasting themes
Funds Reservation / Fiscal Budgeting
In the world of subscription models and operating costs, organizations need to have visibility of funds to support various functions. At project level, each of the projects create their own roadmaps and predict the workloads, subscription costs, and the funds needed to support these projects. At a cost center or business unit level these are then prioritized and then aggregated. A plan is prepared which goes into budgets and funds reservation / allocation.
Forecasting Trends
This is something done automatically by cost management tools based on historic usage, seasonal trends, and in some cases taking input for future growth (or decline). This may use simple statistical trend models or complex ML algorithms depending on the maturity of tooling and the organization using them.
“What If” Analysis
It’s natural for business leaders to ask simple questions like “what if we pull in completion of Project A while deferring Project B”. This usually leads to several parallel calculations for forecasting, each representing a different scenario. Cloud Cost Management vendors provide a way to get endless “estimations” by passing future usage patterns, none representing accurate “prediction” but more a scenario modeling. Some of these may in future may be finalized as the “go to plan” while others saved for future reference.
Assessing the potential for reservations and commitments
Before you commit to a reservation you would want to understand the future spend plans to allow you to reserve at the right level.
Migration Assessment
This is similar to What If Analysis discussed above but again the objective may be to choose the cloud vendor through competitive analysis OR to decide if we want to move to cloud now or later.
Application Rationalization and Rightsizing
Plans can provide insights and help reduce waste via collaborative justifications or approval processes which inform application rationallization stratagies. Opportunities to prevent future duplicated functionality or overprovisioned resources may also be surfaced at the planning phase.
This list is also not exhaustive but gives you a little more detail aligning to some of the key reasons, keep thinking, what is important to you and your organization and take it from there.
Before you start
To start your journey you need to know who is fiscally responsible for the costs incurred that you will be forecasting for. Typically, this will be the team or manager that is responsible for the value being created by the underlying cloud resource.You may find this information via tags, metadata from another source, or naming conventions. You will then need to identify who is actually incurring the costs – typically system admins, engineers, developers, etc. From there, look at the costs being incurred from the business lense the financial owner has assigned to it. If your “owner” is unknown, we suggest that you identify or designate one before you embark on a forecasting process.
Once you are up and running it may be that AI / ML will do the forecasting for you, but our advice is that to get started or to improve your process you need to work with the ‘owners’ of the spend.
Our survey data showed that forecasts mean different things to different people / organizations. For some it means budget, for others it is about an AI / ML tool that tells you what the forecast is, with a wide variety somewhere in between.
Forecasting is difficult. In order to set yourself up for success, begin your journey with small, achievable goals which can be built on over time as you mature, continually improving as you go. Even if you already have a mature forecasting process in place, it is always beneficial to remind yourself of your ‘why’.
A large health insurance company stated, “We assumed while moving to Cloud that businesses are aware / informed how to forecast / estimate workloads, they are not.”
Different types of forecasting
Sometimes people refer to different types of forecasting where others refer to different ways you can forecast, for simplicity we will describe what you might want to consider. It is important to understand that you need to learn what works best for you and your organization. Some organizations may use a combination of the below instead of one method only.
A software company we talked to had impressive forecast accuracy basing their forecasts on a % of revenue, they had enough historic data to know that there was a direct correlation. This made cloud consumption forecasting quite simple. In this example, the responsibility for forecasting fell to the team that forecasts revenue since their FinOps forecasting is an extrapolation of that.
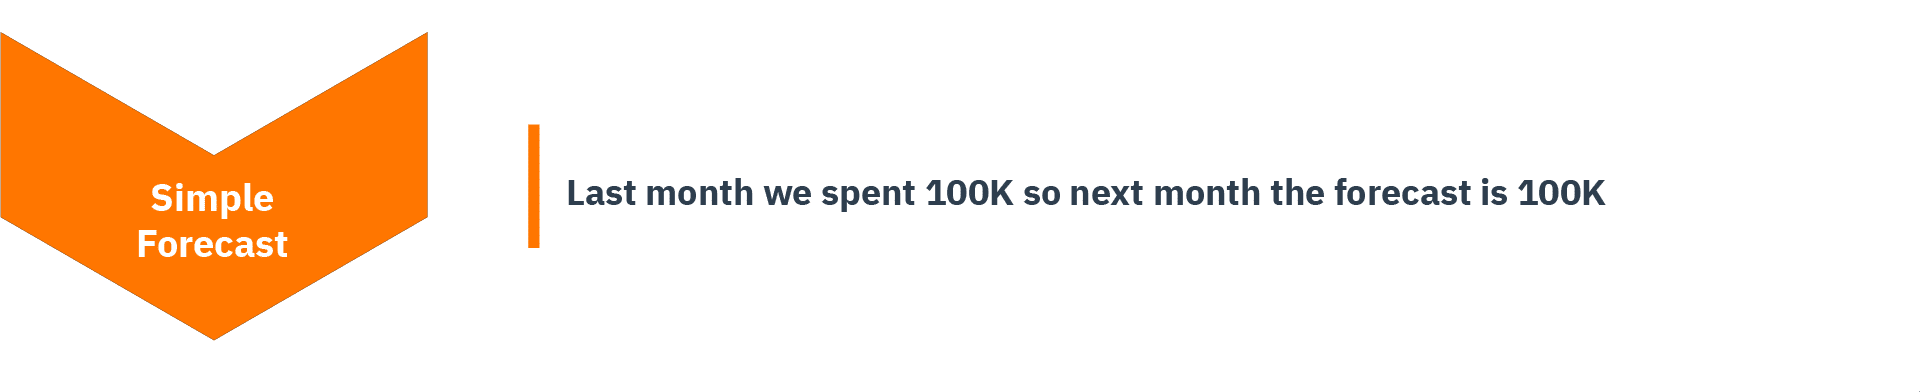
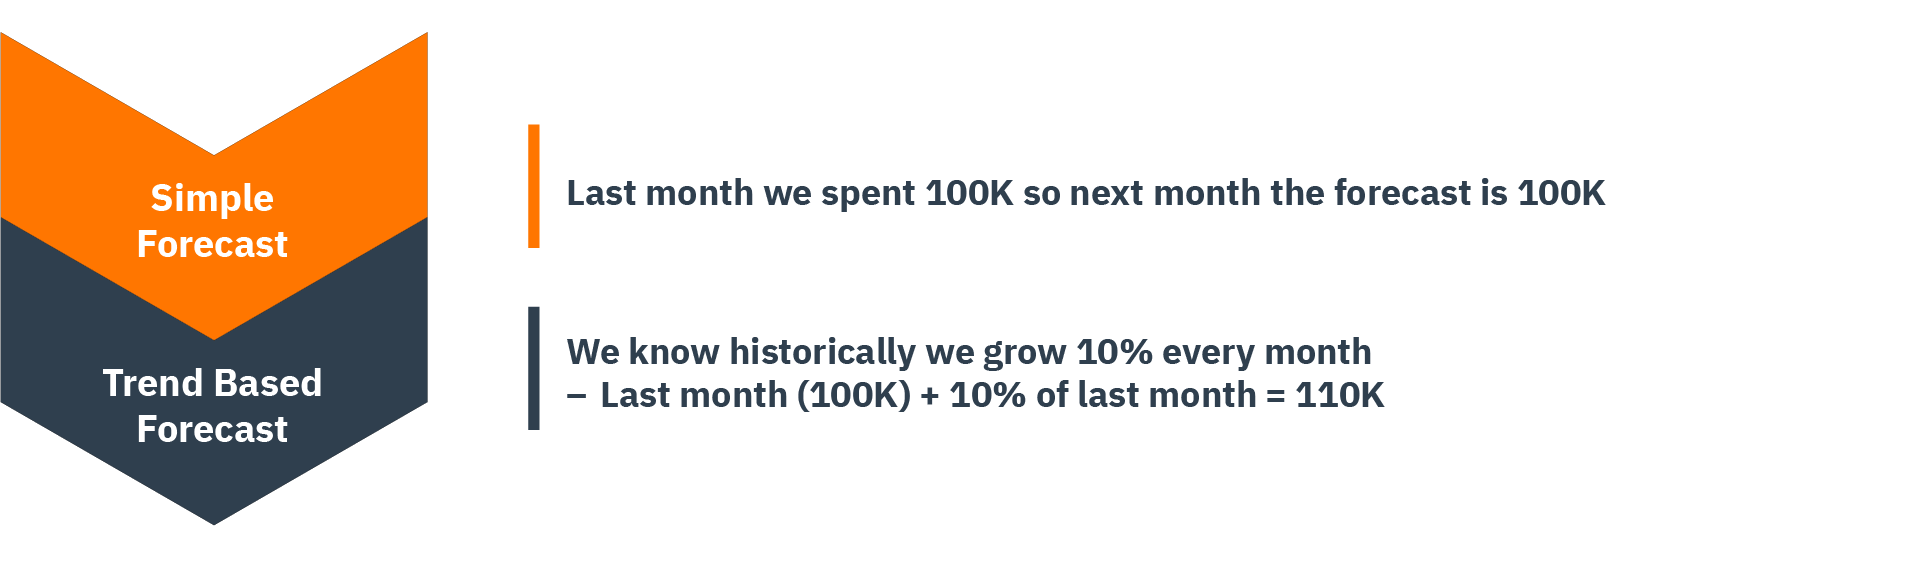
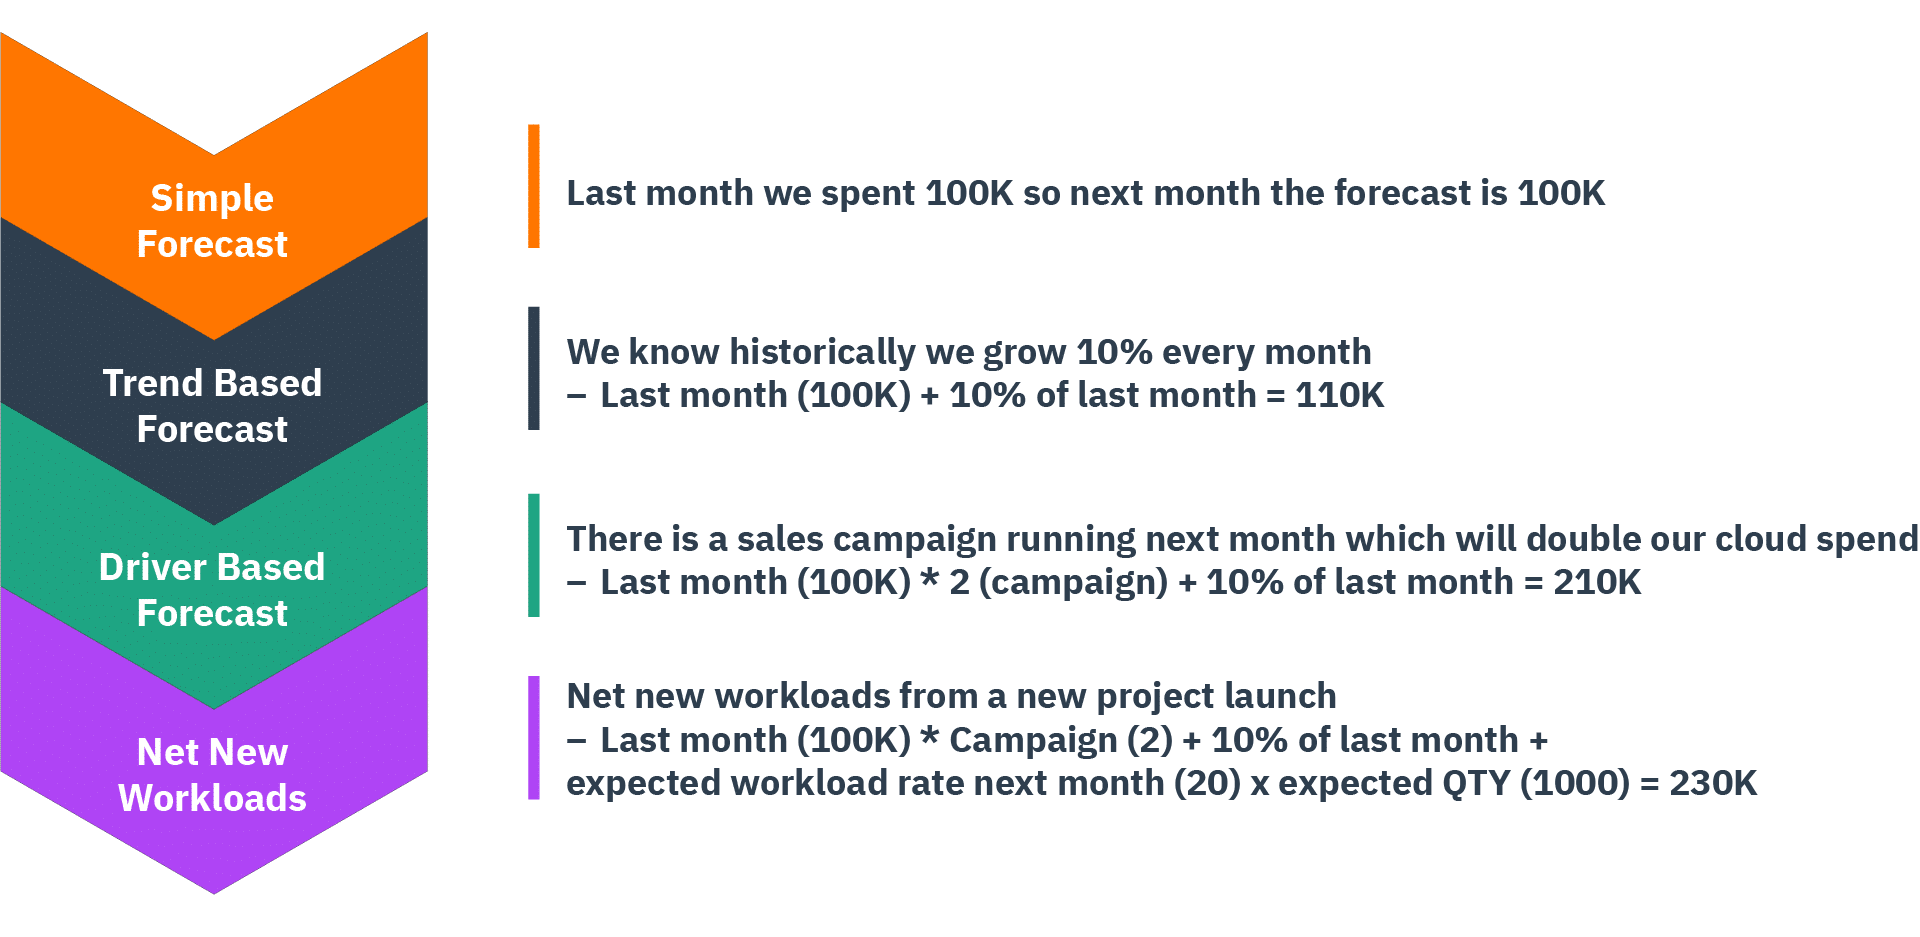
Simple forecasting
This is the most simple of methods of forecasting (sometimes referred to as naive forecasting). It assumes that the spend for the next period will be the same as the last period. If you have no forecasts in place, this is where to start to have something to work from. It is unlikely to give a good level of accuracy over a longer period of time because most businesses and environments are continually evolving.
Trend based forecasting
Using historic cloud spend to predict the future. This is also sometimes called univariate forecasting. This approach takes into account the trend of growth over a time period and assumes the same level of growth will continue into the future. For those that are in a steady state and have quite regular growth, this option could return relatively accurate forecasts.
Driver-based forecasting
Using business KPIs to influence the consumption forecast. The forecast reflects what the business is planning, whether this is a release of a new product, a promotion that is expected to increase demand, black Friday, etc. In order to progress to this level of maturity, it relies on close engagement with your business areas, for those that do forecasting centrally in the FinOps team this will require some effort.
Ensure you consider the month you are forecasting for. A 31 day month is 11% longer than a 28 day month, you should factor this in before you add in any other increases for trends or drivers.
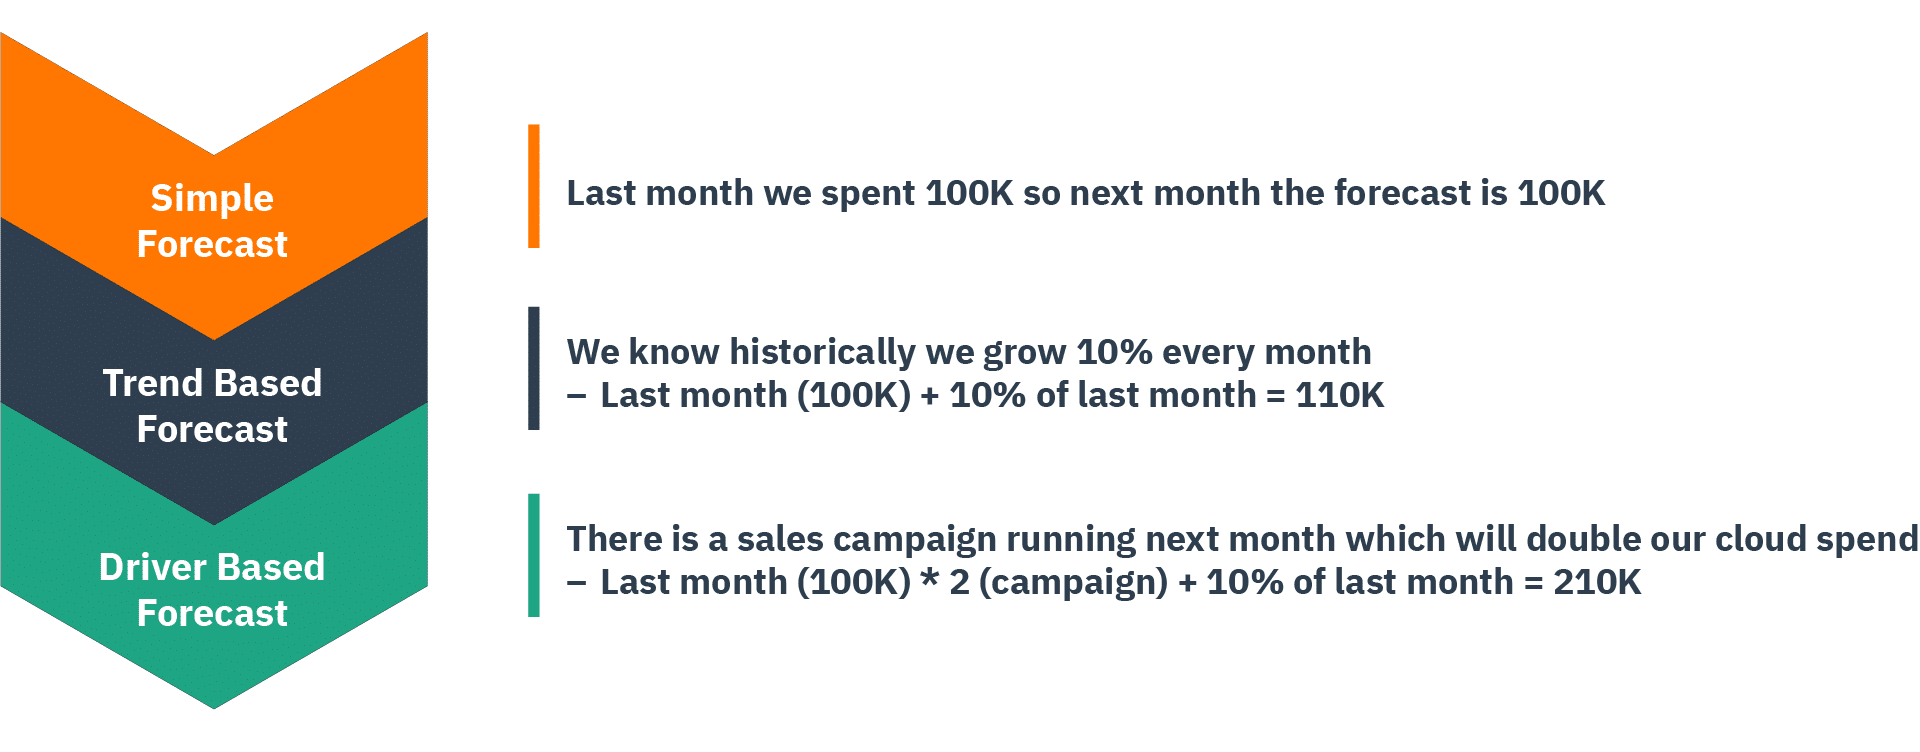
Each of these types of forecasts are like foundational layers helping a baseline forecast to be created.
Driver based forecasting is the type that you should expect to continually review and improve. The process of looking at the accuracy figures allows all involved in the process to learn, what did we miss last month, why did we spend more / less. Remember that getting to 100% accuracy is unlikely but you want to aim to get as close as you can with the effort available. Every forecasting review session should be a learning process and as you do it more your list of things to consider and bake into your baseline forecast grows.
You could consider that once you have worked up the above you have a good baseline forecast and you would then want to explore the next layers of complexity.
You might consider these as all part of driver based forecasting as they are drivers that might impact the forecast but for simplicity we have split them out to allow you to see how it can all layer up. Some suggestions to consider are:
- Rate optimisation – Reservation purchases
- Usage optimisation
- Changes of cloud products with a different price point or model
A large technology company stated, “Don’t ask for ‘sports car’ resources if you can manage on ‘power scooter’ instances, and we reduced cloud spend by 47% in last 18 months using this principle.”
Net new workloads forecasting
All the examples above are based on existing workloads and drivers that might impact their forecasts. The next layer to consider is new workloads or pipeline forecasting. For organizations that are early in their cloud migration journey this will be key (and also quite challenging). As we have said before there are no wrong or right approaches but these are some suggestions that might help you improve the quality of forecasts for new workloads:
Model based on existing application / workload
Depending on your maturity of cloud adoption it may be that those involved in forecasting have sufficient insight as to how much an app of this type / style / complexity / architecture costs. As you can see from this list there are many things that could help with early forecasting.
Public calculators
If you do not have a suitable ‘similar’ application to model your future workload forecast all the cloud providers have public calculators where you can plug in all the elements that will be planned to be delivered and it will provide you a cost. The calculator approach sounds like a perfect solution but it does come with its challenges. In order to use the calculator you need to know what cloud products are going to be consumed, at the minimum a high level design would be required.
There is also a common issue that those using the calculator do not add in all the products that will be used resulting in a forecast lower than the actual. There is also the counter of this where individuals will over estimate resulting in a bigger forecast than reality. In the absence of anything else the calculators are a very good place to start but expect that they are unlikely to be exact and should be used when a ballpark figure is good enough in the early stages.
Data from other sources
If you do not have a similar application and do not yet have a design, the fall back position is to generally use the numbers that are available (such as a business case or project plan) for consumption spend. This will likely be a very vague number but at least it is a start and can be improved once more detail is known.
A video streaming company stated “We used trend-based forecasting which was better but still had a large variance e.g. from 20% to 70%. This was because trend-based forecasting looked at aggregate spend per cloud workload and had no visibility into new workloads that didn’t yet exist in the cloud.”
Whichever approach your organization chooses to use for net new workloads (or a mix of various approaches) the advice is that it is better to include pipeline forecasts even if you do not have a lot of confidence in the number. Capture the assumptions made and iterate it moving forward. The goal is to get better at forecasting, do not let perfection get in the way of progress.
As the workload gets to the design stage, review the forecast and then when actual spend comes through to help with the forecasting review cycle; the business case is refined. The key thing is to start with something instead of waiting for a polished forecast, remind yourself of the reasons forecasting is important and that will help you decide how much energy to spend on forecasting for something that isn’t known.
Note: workload costs come from cores or some compute metric for the license x time x rate.
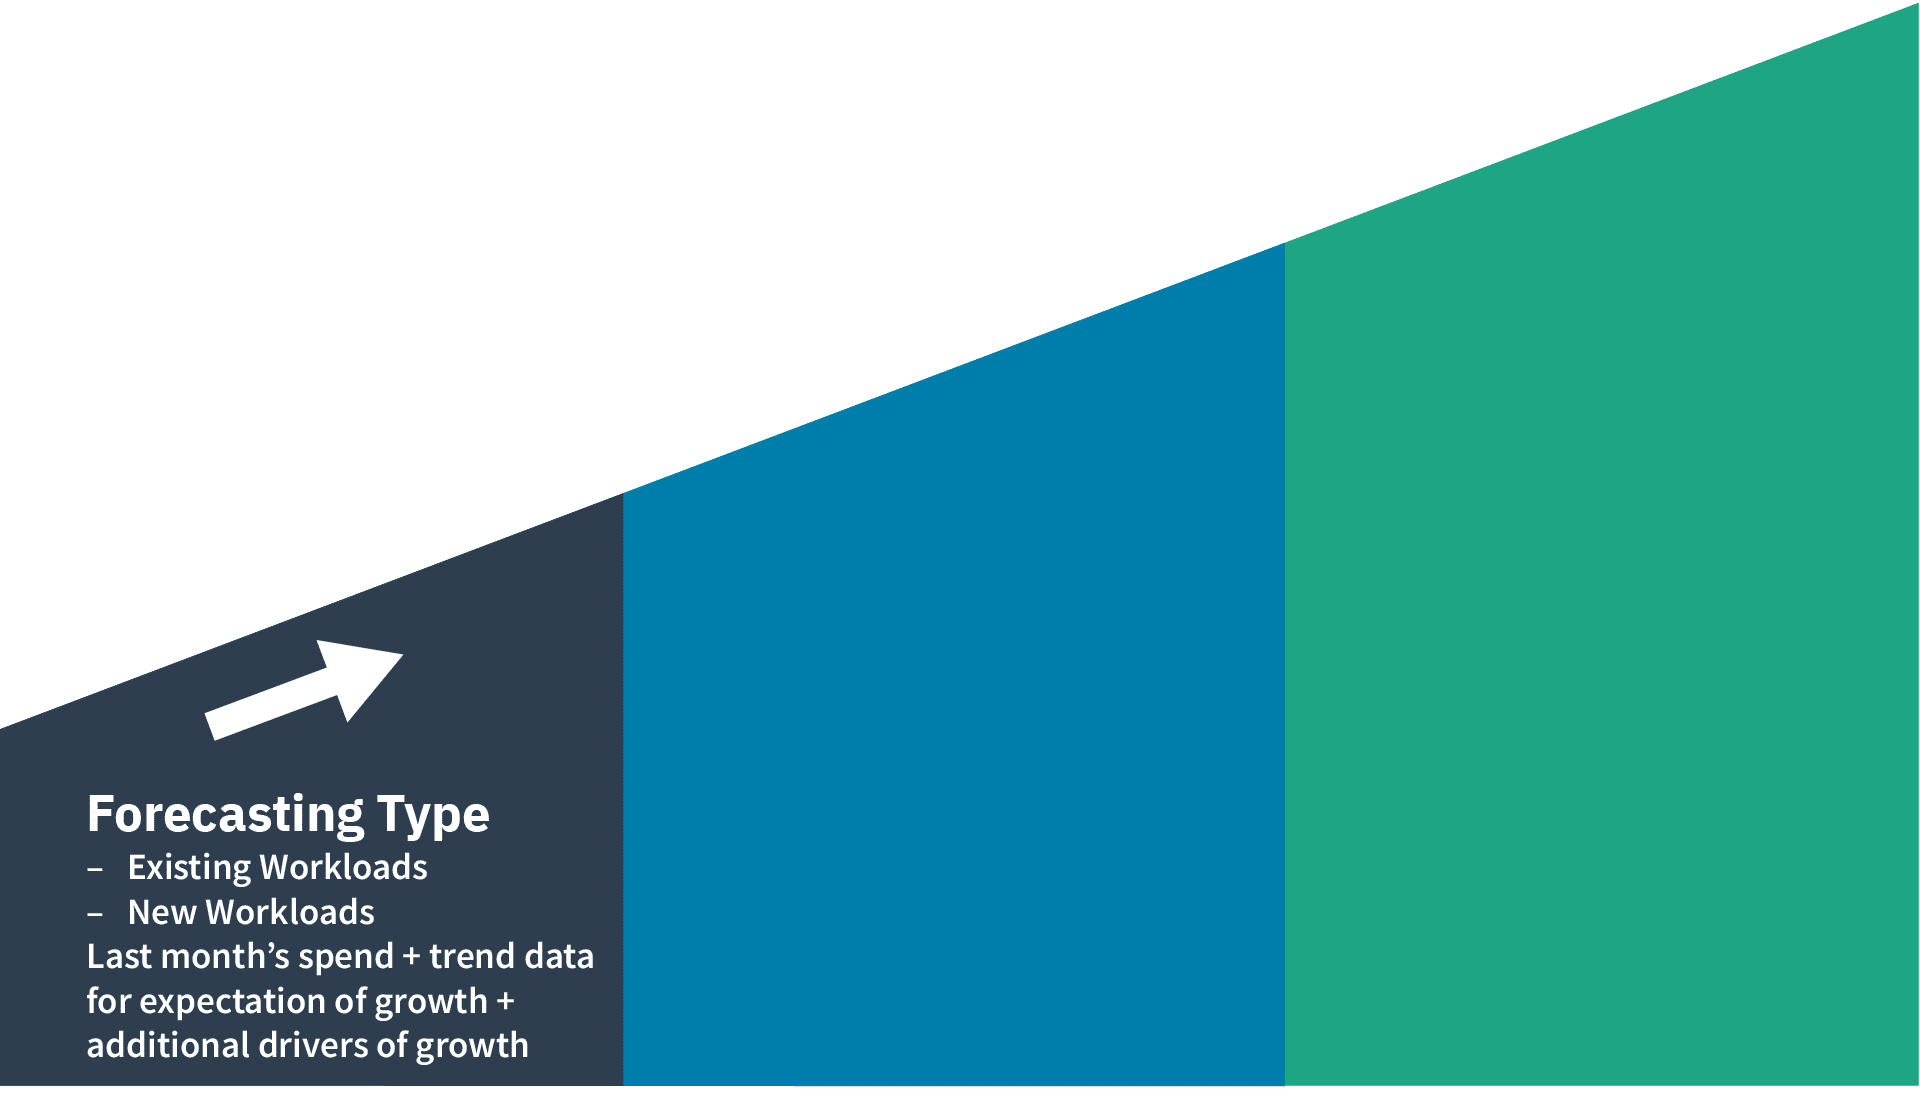
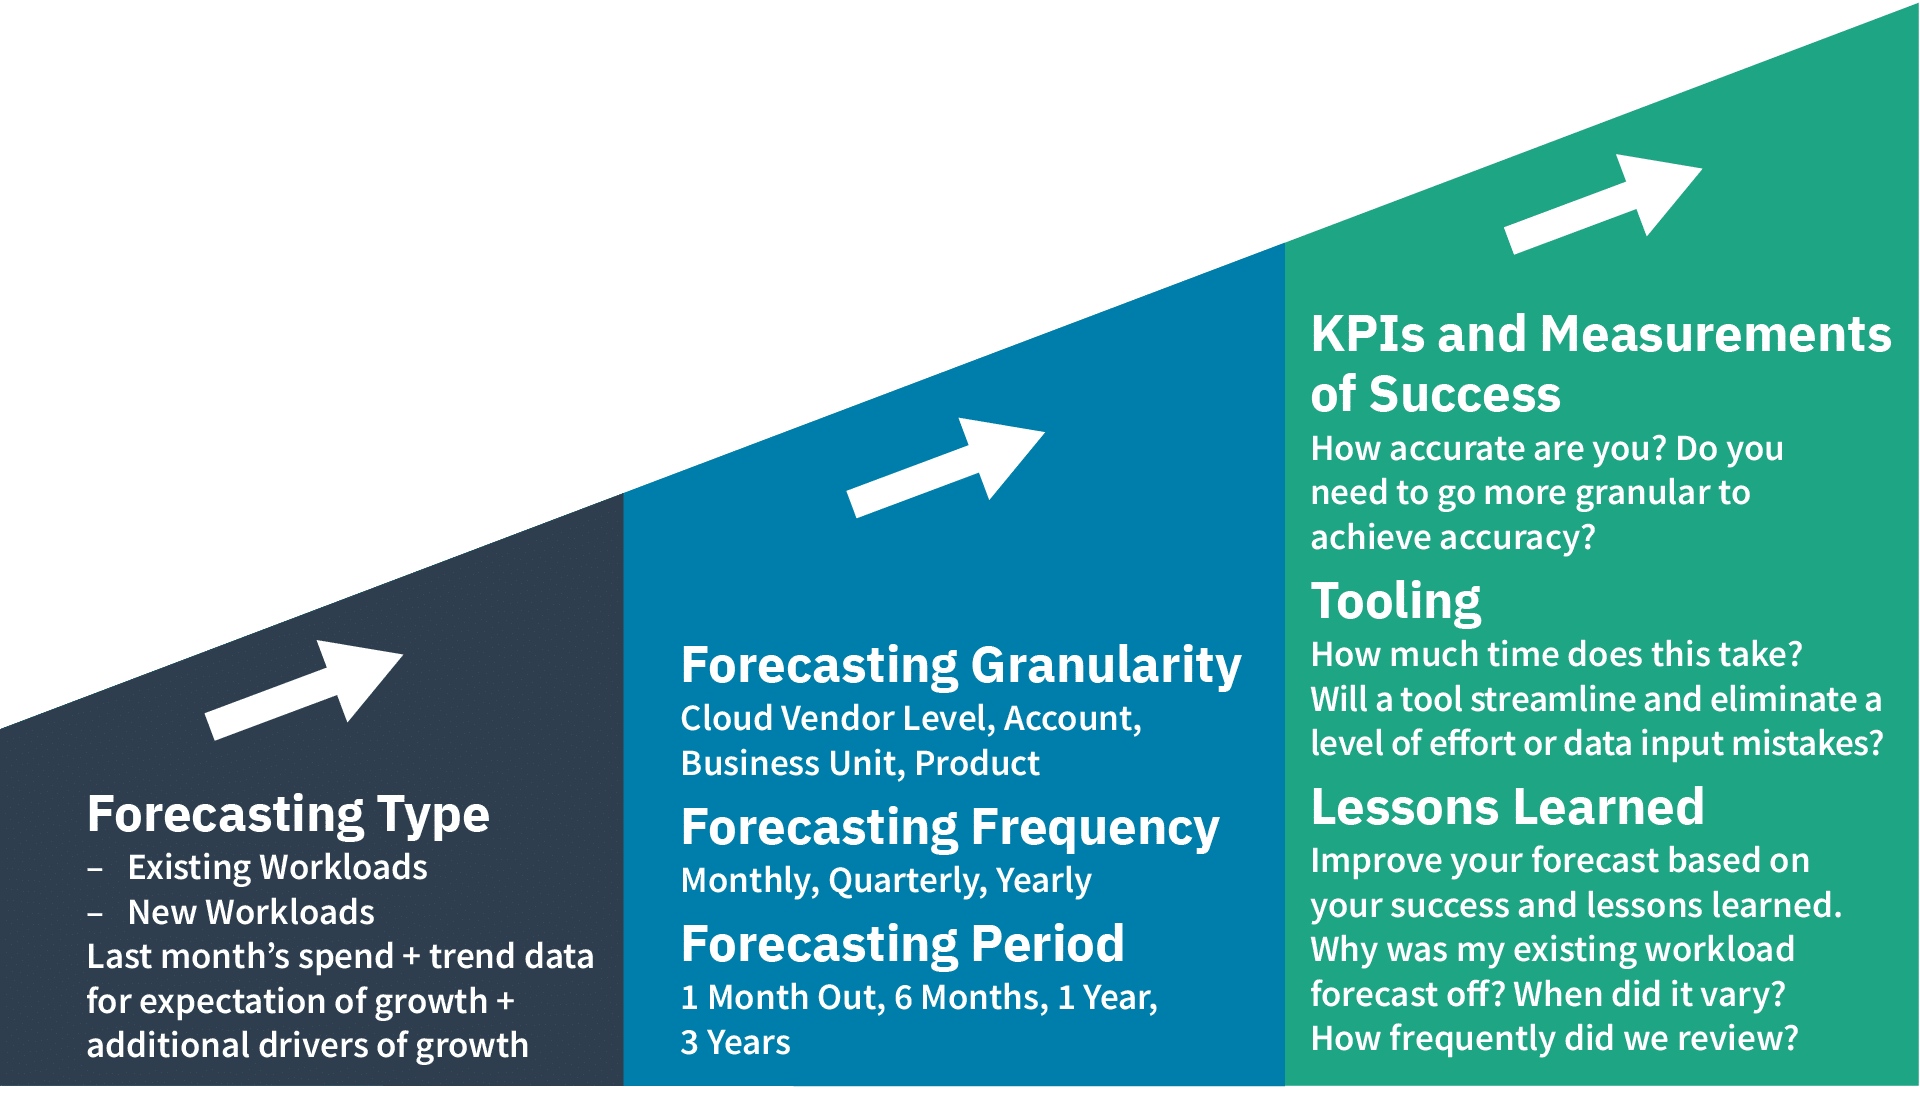
The below image shows the beginning of your forecasting journey – determining your Forecasting type(s):
If you choose to have a forecasting accuracy KPI (more later in the paper on KPIs) you may want to consider setting a different KPI for net new workloads due to the challenges associated with this type of forecasting. Also it might help win hearts and minds on your forecasting journey and also help those business areas coming along at a later date.
Personas involved with cloud forecasting
The first principle of FinOps is “Teams need to collaborate.” Collaboration is the engine of the practice of FinOps, enabling continuous improvement and fast decision making. Cloud practitioners need to understand who the key stakeholders are, what they contribute, and what requirements they have. This will determine the frequency, granularity, and quality around forecasting. Review the FinOps Foundation Personas page for more detail as to the various personas that might be involved or interested in the cloud forecasting process.
FinOps Forecasting Working Group Survey
The FinOps Forecasting working group survey was conducted in Summer 2022. A total of 14 questions were asked, 49 FinOps practitioners responded, and 11 follow-up interviews were conducted with the goal of better understanding practitioners doing forecasting work, their methods, challenges, and successes. Here is a summary of the results.
There are various measures of maturity for forecasting, one that is published in the State of FinOps is % (percent) accuracy, but we wanted to explore more than the accuracy of the forecast and as such, slightly modified the definitions for which respondents rated their maturity level against.
- Pre-Crawl – Haven’t started, but have plans to in the next 3 months.
- Crawl – We are getting the basics in place, manual approach, not easily repeatable.
- Walk – We have core processes running that are repeatable, but much maturing to do.
- Run – We are continuously improving a built out practice.
We will share the results later in the paper, but we wanted to thank all those that took the time to respond or speak to us in the follow up interviews. To best understand the various terms and concepts throughout this guide, please review relevant cloud forecasting terms.
Forecasting granularity
What level of granularity should you forecast at? How granular should forecasts be? This is challenging to give a definitive answer because every organization is different. This is an important decision to make before you dive in, if you set your forecasting process at too high a level of granularity and then need it broken down to a lower level this will require a full rework. Forecasting at the lowest level (perhaps subscription / account / project) gives you the ability to slice and dice the resulting forecasts to cover the majority of views you would need. This however comes at a cost, it takes more effort the lower level of granularity.
The graphs below are taken from the working group survey and show the levels that respondents forecast at based on their chosen maturity. The choices given were:
- Cloud vendor level (I plan to spend X on each CSP)
- Business Unit (each operating unit plans to spend Y)
- Business Application / product (for each application / product we plan to spend Z)
- Account / Project / Subscription (For every account/project/subs we have a forecast)
- Organization Program / Project (Forecast for a defined solution delivery)
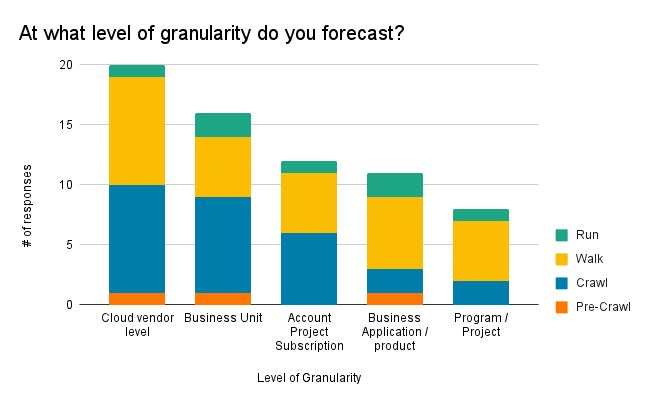
There is no right option but consider the reasons you want a forecasting process, what data you would want to present when the process is up and running, and the overhead of running the process.
A UK bank that set up the forecasting process from scratch decided to create the forecast at the subscription / project / account level. The reason for this was that the data could then be sliced and diced in any way they chose, whether it was by application or business area or development environment. The overhead when doing it manually is higher the more granular the forecast, data can always be consolidated but drilling down is challenging and time consuming if the data does not exist.
Forecasting frequency
Frequency of forecasting means how regularly your forecasts are refreshed, reviewed and updated. This is another choice for you to make based on why you need forecasts, for example if your “why” is simply to inform the budget cycle you might choose to carry out a forecast process once or perhaps twice a year to align to the budget cycle.
The survey responses to this question were:
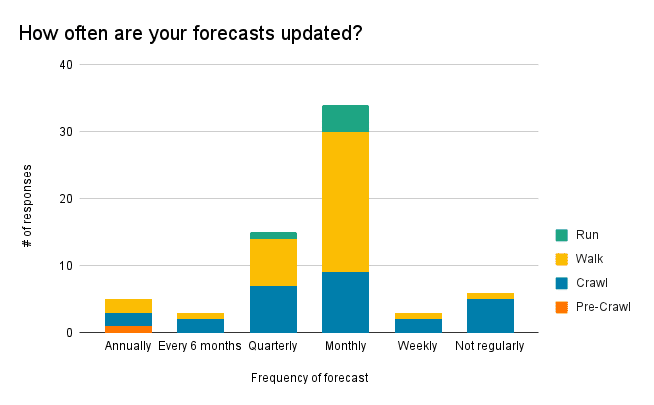
For the run respondents that chose “Other,” the detail was that they were on-demand / live time.
You will need to choose a frequency that is appropriate to your organization and the goals you have for forecasting. Tooling becomes key at this stage, if you are reliant on manual updates to spreadsheets that are then consolidated together the chances are that carrying out this activity more frequently than monthly would be challenging, even monthly might be too frequent.
In order to operate your forecasting process there should always be a forecasting review cycle. Forecasts are compared to actuals (inform), learning happens to help optimize the forecasting process and the cycle continues. If you choose to do your forecasts and not review them regularly you really are missing out on the phases of FinOps and it goes against the principle of reporting being timely.
You might want to consider how much your forecasts are actually changing from each time period to the next. If it is minor, then you may decide to save effort and do them less frequently. As we keep emphasizing, it comes down to your “why” you are doing forecasting, as the importance of it will help drive these efforts.
Forecasting period
Forecast time period means the length of time that you create forecasts for, for example do you just want to know the forecast for the next month or do you want it for the next five years. Refer back to the section on why forecasting is important and understand your goals for forecasting. If your forecasts are a key element of your budgetary cycle you might want to align to a similar timeline; if you have a contractual commitment that runs for a certain period you would want a view over the same period; understand your stakeholders and what they would need from the forecasting data as this will help inform your decision.
In the same vein as – forecasting for net new workloads is difficult, the further you go in the future the less certainty there is. For some organizations they will forecast for the next 12 months and when they need the data for a longer time period they will apply some logic to it for future years. For example, use the forecast for the last month of the forecast period and project that forward at a flat rate (conservative approach) or project it forward with x% growth based on past history.
The survey responses to this question were:
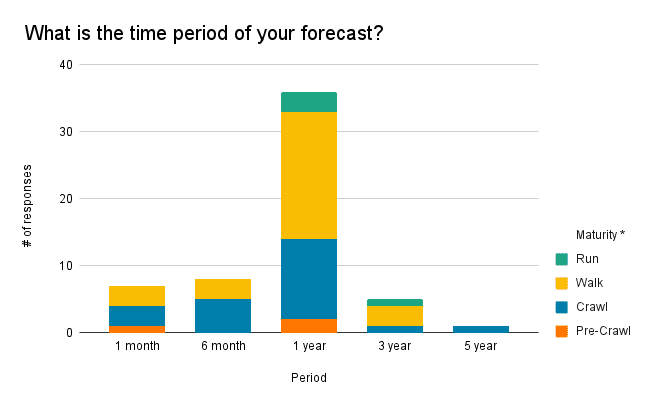
This shows that organizations mature on their forecasting journey they look to forecast for a longer time period. Unlike granularity of forecast where you benefit from doing your thinking up front to avoid rework, this is an example of how you can start simple and evolve as the process matures.
Survey key takeaways
Here are some key takeaways from the survey results, in addition to the analysis above.
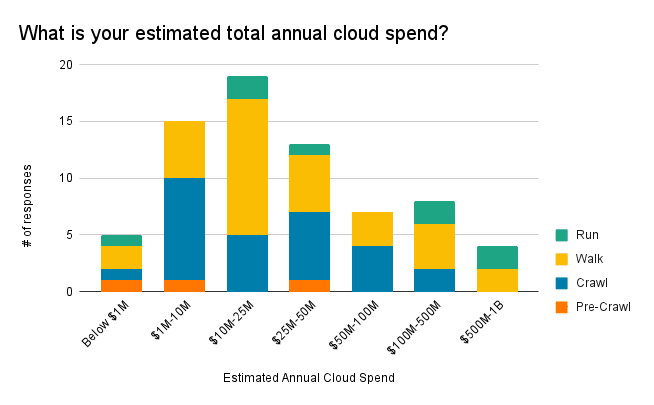
- Many respondents with substantial spend in the Crawl maturity, while no Crawl maturity reported within the $500M to $1B annual cloud spend range. This correlates a theory that as spend increases, so does the need and priority of having a more mature FinOps practice in place to support.
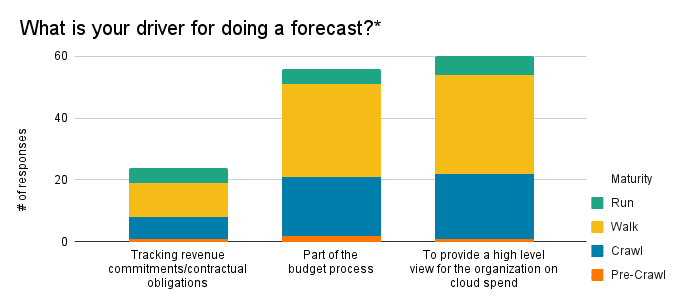
- Forecasts are driven by ad-hoc requests within the Crawl maturity e.g.requests from Finance or vendor negotiations, while more mature practices have forecasting integrated with other business processes e.g. budgeting and optimizations. Part of growing in maturity involves getting away from unwieldy tasks and instead moving towards repeatable and consistent reporting and forecasts.
- More mature respondents updated forecasts more frequently and have longer periods for forecasts. Individual forecasts cater to specific purposes e.g. accruals, budgeting, contract commitments (see update frequency graph above).
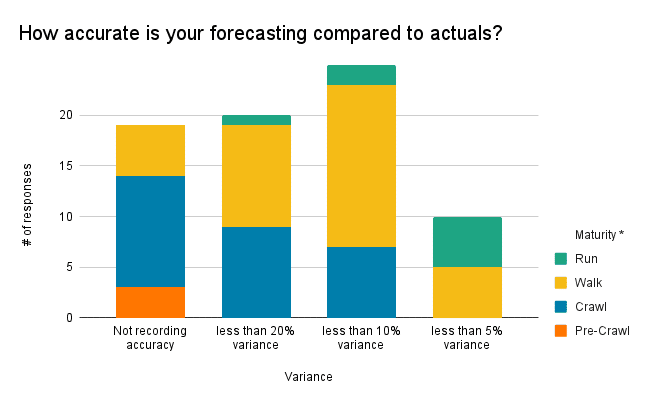
- Our findings also emphasize that the accuracy of your forecasts become more important as the practice matures.
- There is no one-size-fits-all when it comes to forecast granularity although more mature practices generally forecast at a lower level of granularity.
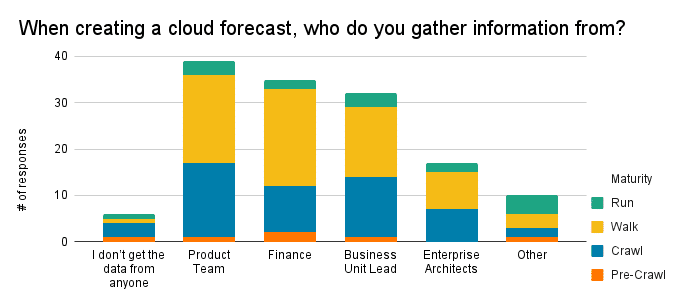
- In order to forecast at any level of maturity, data from multiple sources needs to be aggregated. The type of source will differ between organizations.
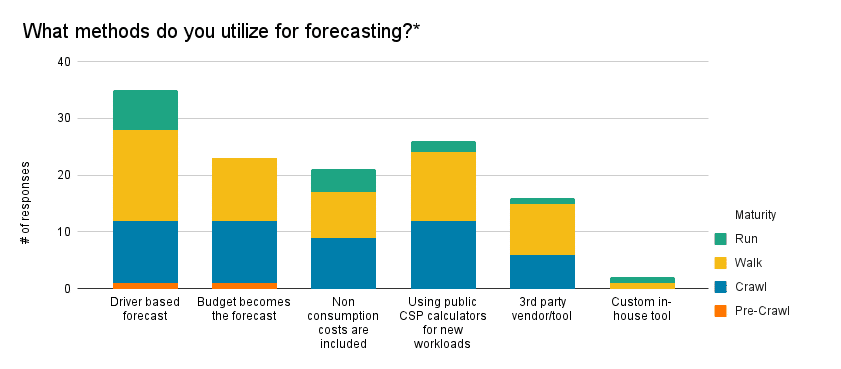
- Extrapolation is the most frequently used forecasting method followed by a variety of in-house and 3rd party tooling. Forecast numbers can be list or public, enterprise discounted, or net pricing.
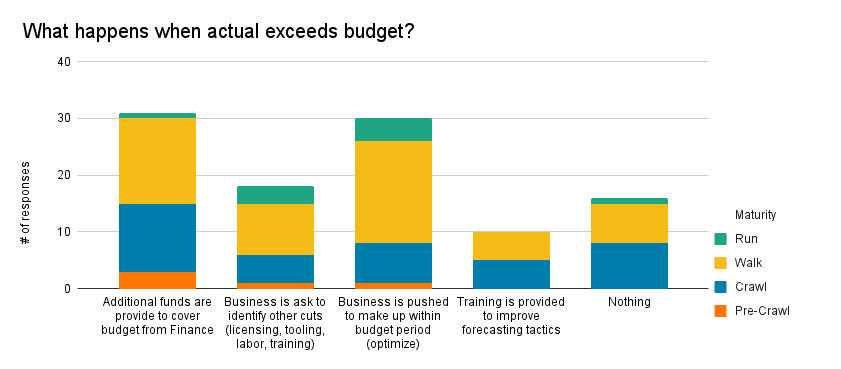
- Budget overruns are surfaced to workload owners who decide how to remediate. Optimizations are often chosen to bring spending on track.
Additional insights include:
- Stakeholder buy-in is critical for success e.g. Finance, engineering leadership, and engineers.
- Estimation and changes in estimates of new workloads and new technologies being used in the cloud e.g., security or network enhancement features as well as usage optimization efforts are challenging.
An Insurance company “During contract renewals, we work closely with workload owners & department leaders to get a holistic view of spend trends for the next 3-5 years. We have been fairly accurate at enterprise level (only 10% variance), but we see large variance at department level.”
Build on your data sets by determining granularity, frequency, and forecasting period to grow your forecast efforts.
Practitioner Lessons Learned
Eleven follow-up interviews were conducted. The following are the lessons learned shared from these interviews.
Forecasting is a journey
When starting to implement Cloud Forecasting processes, think of forecasting as a journey. It will take considerable time to prepare data sources for ingestion and get everyone onboard and involved. Specifically, some forecasting deliverables rely on engineering leaders and engineers to contribute. The FinOps team will need their support as well as support from executives and Finance.
Forecasting methods are one source out of many
Whether a manual, trend-based, or driver-based methodology is used, the forecasting algorithm is just one of the sources. Additionally, estimates for new workloads and new technologies adopted in the cloud e.g., security or network enhancement features as well as usage optimization efforts are needed.
FinOps and forecasting success requires cross-team collaboration
The FinOps team will need the support and collaboration from application owners, engineering leadership, and engineers. When building annual forecasts, it is recommended to build-in a reasonable management reserve or buffer to prevent unnecessary churn later when single digit percentage overruns materialize.
Expect growing pains and turbulence on the path to forecasting
Any forecasting system will experience issues when fitting trends or drivers to workloads. Not all workloads grow by a floating-point number, and in extreme cases these can compound to substantial Dollar numbers that cannot be ignored.Having a buffer will help smooth these issues until the FinOps team can remediate.
Delight teammates to encourage successful collaboration
When engaging application owners, engineering leadership, and engineers the FinOps team needs to do everything in their power to make this experience as delightful as possible as more support and collaboration is required in the future.
It is not advisable to present forecasting partners with an empty spreadsheet. Provide as much data as is available in a format that is easily digestible. Most of the FinOps partners have existing roadmaps and deliverables and the FinOps team needs to be respectful of their time to ensure future support.
Collaboration is the engine of the practice of FinOps, enabling continuous improvement and fast decision making.
Use cloud forecasting as a FinOps coaching opportunity
Cloud Forecasting should not be perceived as a tool in a spreadsheet. The FinOps partners need to understand why the process is important and what their role is. Many partners will have knowledge gaps or will need clarification e.g., are forecasts in list or public, enterprise discounted, or net pricing. Proactively reach out to the FinOps partners and ask how you can assist in the process. Collaborate and engage to ensure best outcomes.
Forecasting KPIs
Measuring performance is of great importance to most organizations. Before you start creating a cottage industry of statistical creation think about what is important to you and what a relevant measure might be. This section will evolve in future iterations of the paper but in order to get you started below are some KPIs geared towards forecasting, based on maturity.
It is important to note that while this maps to the most advanced level of maturity, ensure that your organization’s maturity goal aligns to what makes sense and works for you. For example, frequency of forecast updates, depending on factors such as automation or level of effort for forecasting may mean that near real time would be more effort for not enough of a positive impact. Your organization may decide that monthly is suitable for the goals and needs you are trying to obtain.
| KPI | Level 0 | Level 1 | Level 2 | Level 3 | Level 4 |
|---|---|---|---|---|---|
| Frequency of forecast updates | N/A | Yearly | every 6 months / quarterly | Monthly / bi-weekly | Near real time |
| Top Line Forecast Spend Variance (Forecast v Actuals) over a period of time | >20% | <20% | <15% | <12% | <5% |
| Category Forecast Spend Variance (Forecast v Actuals) over a period of time | >20% | <20% | <15% | <12% | <5% |
| Commitment based discount coverage | <10% | 10 – 20% | 21 – 50% | 51 – 80% | >80% |
| % of tagging compliance | <10% | 10 – 20% | 21 – 50% | 51 – 80% | >80% |
*Note, these KPIs are not exhaustive but meant to be some starting KPIs to consider using within your organization.
A practitioner from a software provider: “We would love to focus on forecast accuracy as much as the topline accuracy.”
A practitioner from an energy company: “While our forecasts are very accurate (up to 95%), a struggle we have encountered is effectively communicating what level of confidence we have in the forecasting that we produce.”
Forecasting tools
There are many tools that can be used for cloud forecasting and choosing the correct one can be a daunting task. It is important to consider what your goals are for your cloud forecast and what is important to your organization. To support this exercise, we have compiled a list of questions to ask when researching a tool pertaining to forecasting. Most companies will want to research a tool that performs more than forecasting, which is outside of the scope of this section.
A utility company: Don’t [overly] rely on tools for forecasting because it doesn’t know what’s coming up/any new workloads.
- Granularity – the ability to provide forecasts at various granular levels (account, team, types of resources)
- Handling of special (known) events – e.g. sales periods, holidays, product releases
- Adaptivity – ability to automatically adapt to changes in cloud spend behavior
- Handling of trends and other patterns (not just seasonality) automatically
- Handling of cost data that is updated in delay
- Time period outlook (1 month, 3 months, 1 year, 3 years?)
- Leveraging influencing KPIs on cost – e.g., # of MAU for an app, # of purchases (e-commerce) — to create more accurate forecasts
- Automation / manual adjustments
- Tagging capabilities and customizations
The determination of using a tool also should include consideration to where you are in your cloud journey, how much cloud spend you have (or plan to have), integration into other tools or capabilities (cost optimization, etc).
Finally, integrate KPIs, benchmarks, tools, and lessons learned for a comprehensive forecasting process which can continue to build on itself iteratively as your organization grows and evolves.
See tools and support channel or partner pages that support the forecasting capabilities.
Forecasting maturity matrix
We have talked a lot about needing to decide what is important to you and your organization. We did want to give guidance on what different levels of maturity might look like. You may disagree, and that is fine, but the following table gives a view on what could be considered measures for the degree of maturity when it comes to forecasting.
To date, in most cases, the only measure used and quoted is forecast accuracy. This is such a blunt measure, as an organization could have excellent accuracy and it could be down to a lot of hard work or simple luck.
Take your pick from these to help you consider what is important and what you might want to aspire to as you mature on this journey. You may want to change the measurement, for example, your forecast time period might be one month for crawl, 6 months for walk and 12 months for run.
| Cloud Forecasting Maturity Matrix | Last revised: 7/29/2022 | ||
|---|---|---|---|
| Forecasting Area | Crawl | Walk | Run |
| Tooling | Manual in spreadsheets | Leverages automation in part via BI tools | End-to-end process automated with few manual inputs |
| Forecast Time Period | 1-year depending on requirements | 1 to 3-years | 3+ years |
| Forecast Update Frequency | Annually | Quarterly or Monthly | Monthly, weekly, or daily |
| Who drives Forecasts | Centrally FinOps or Finance | Decentralized in part to engineering leaders | Engineering leaders have ownership |
| Forecast Method | Annual percentage growth swags | Exponential smoothing / machine learning | Driver based |
| Forecast Repeatability | Not easily repeatable | Core processes repeatable | Repeatable with continual improvement |
| Forecast Granularity | Account / subscription | Cloud workload | Cloud service / SKU |
| Forecast Variance | 20% | 10% | 5% |
| Forecast Reporting | Spreadsheets shared via email | Combination of online reports and spreadsheets | Mostly online with exceptions |
| Forecast Process KPIs | None or not well established | Trending of forecast accuracy | Utilize KPIs to adjust forecast method |
| New Workload Estimates | Swag for top new workloads | Utilize cost calculators to estimate largest workloads | Majority of workloads estimated and peer reviewed |
| Workload Optimization Estimates | Swag for top optimization initiatives | Engineering leaders provide detailed estimates for largest initiatives | Majority of optimizations estimated and peer reviewed |
| Forecast / Budget to Actual Feedback Loop | None or annual but not well established | Annual with the largest workloads reviewed monthly | Monthly reviews and real-time budget overrun alerts |
Conclusion
There is no doubt that cloud forecasting can be complex and varied based on industry, organization, maturity, and many other factors. There is no one simple answer on how to do it but the paper should give you enough food for thought to consider what is relevant and of interest to you and your organization. With your help it can continue to evolve and become an even better resource. Come and join the conversation in the Forecasting Chat group or get involved in the next sprints of the Working Group.
Final thoughts – know what your “why” is and use it as a guiding principle when making decisions about your forecasting approach and process.
We like to think that good forecasting takes effort but is worth it!
Get involved & informed
Please get in touch in the Slack Forecasting Channel if:
- There is an area you would like to see more examples or detail on within this asset
- You have some content or an idea for content that you think should become a future Working Group project, an improvement of Forecasting Capability, FinOps Personas, or other parts of finops.org
- You have a forecasting user story that could be shared on the site or on the FinOpsPod
- …in fact, we would love to hear from you with any feedback!
If cloud forecasting (and other critical FinOps capabilities) is something you or your teammates require more training in, consider our FinOps Certified Professional course. If you are reading this and aren’t a FinOps Foundation member yet, we welcome you to sign up and join.
Thank you to all our Project contributors
The FinOps Foundation extends a huge thank you to the members of this Working Group that broke ground on this documentation:

Alison McIntyre
Lloyds Banking Group
Kate Ferguson
Liberty Mutual Insurance
Jerry Hess
Hennepin County
Lindbergh Matillano
Avalara
William Nieusma
AgileTrailblazers
Amanda Dalton
Deloitte
Michelle Dupuis
Daugherty Business Solutions
Alex Kadavil
Target
Eric Lam
Google
Yogendra Joshi
GoogleAlso, we’d like to thank our Technical Advisory Council (TAC) Liason, William Bryant of Apple.
Thank our supporters and interviewees
Thank you to all of our survey responders and interviewers, without your insights this paper would not be what it is today!
- Dieter Matzion, Roku
- Nik Jethi
- Dustin Mullenix
- Max Audet, Coveo
- Venkat Karpuram, Broadcom
- Michelle Cleland
- Brad Payne
Lastly, a big thank you to the FinOps Foundation support team for helping us bring our work to life: Ashley Hromatko (Staff Sponsor), Samantha White (Program Management), Tom Sharpe (Design), and Andrew Nhem (Content).